

HIA Image
Press Release: HIA Launches 4 AI Features Built Natively into its Hospitality ERP
Hotel ERP and Accounting Software Logo Hotel ERP and Accounting Software Logo
  • Home
  • Platform
      Hospitality Accounting & Operations
    • AI-Powered Platform
      Backoffice Automations

    • Hotel ERP Platform
      Ops & Accounting Clarity

    • Integrations
      60+ Hospitality Specific
    • Features & Capabilities
      Built for Hotels

    • Halo GSS
      Rep Mgmt, Comp Sets, Rate Intel
    • Business Intelligence
      Your Whole Hospitality Timeline
    • Mobile App
      Your Backoffice in Your Pocket
  • Features By Role
    • For Finance Teams
    • For Operations
    • For Executives
    • For Owners
  • About Us
    • Executive Team
    • Acumatica
    • Awards
    • Board of Directors
    • Support
    • Careers
    • Contact Us
  • Resources
    • Blog
    • In The News
    • Customer Stories
    • Guides & Downloads
    • Videos
Request A Demo

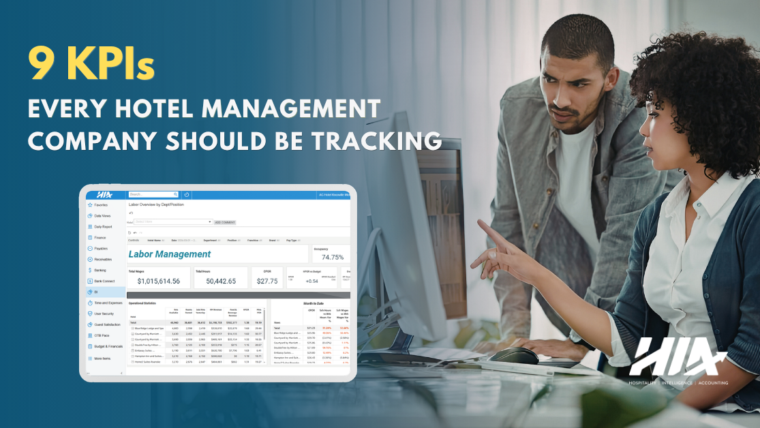
9 KPIs Every Hotel Management Company Should Be Tracking

August 18, 2026
By Charlie Fritsch, CEO
  • Accounting software
  • Business Intelligence
  • Streamlined Financial Management
9 Financial and Operational KPIs Every Hotel Management Company Should Be Tracking

One of the things I’ve learned from evaluating hotel portfolios over the years is that similar operating results don’t always translate into similar financial performance.

Two management companies can report nearly identical occupancy, ADR, and RevPAR while producing very different profit margins and long-term value. The difference usually isn’t found in traditional performance metrics. It’s found in the operational and financial indicators that explain why those numbers look the way they do.

Most of these KPIs are only evaluated after the monthly P&L closes. If you’re looking for a competitive advantage in a market where top-line growth can no longer mask bottom-line cost pressure, then these nine KPIs deserve more of your attention.

1 & 2. Gross Operating Profit (GOP) Percentage With Flex & Flow-Through

When it comes to answering questions about profitability, the first places you should look are the GOP percentage along with the Flex/Flow-Through. Combined, these KPIs will show you if you’re meeting financial targets and how well you’re converting revenue to the bottom line. 

One gives you a number that shows where a property stands after operational expenses are paid. The other helps you understand how well your property handles revenue shifts and whether you’re keeping the money you’re generating or if it’s being absorbed by rising costs.

For example, imagine two full-service properties in your portfolio both post a 10% lift in total revenue, adding $100,000 to the top line. Hotel A converts $55,000 of that new revenue into GOP, while Hotel B only converts $15,000. Even though Hotel B is still profitable on the P&L, its low flow-through indicates that something swallowed the additional gain. 

It’s important to note that judging a property’s health solely on GOP% during a market downturn conflates macroeconomic headwinds with operational performance. These metrics need to be evaluated together because they separate true cost discipline from market fluctuations. 

When you’re able to track these two metrics side-by-side, you’ll be positioned to turn tomorrow’s revenue growth into lasting profitability. 

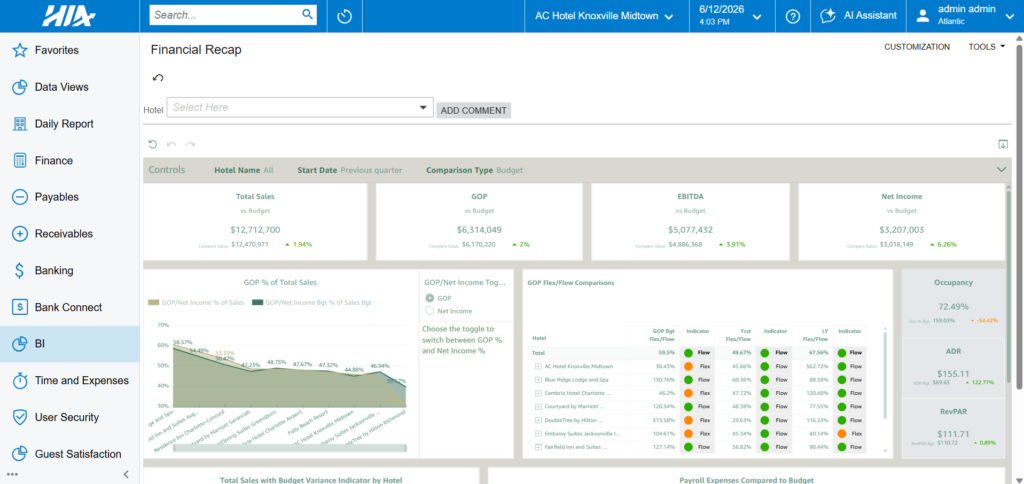
HIA Business Intelligence tool that allows users to track GOP% and Flex/Flow comparisons on the same dashboard.

An example of HIA’s Business Intelligence tool that allows users to track GOP% and Flex/Flow comparisons on the same dashboard.

3. Guest Satisfaction Sentiment

One of the most overlooked leading indicators in hotel operations isn’t financial at all (at least not on the surface). Guest satisfaction sentiment is typically viewed as just another vanity metric to assess reputation. However, it’s one of the earliest indicators that rate erosion and direct-booking losses may be on the horizon. 

A small slip from 4.5 to 4.2 stars might not raise any immediate flags. But when you take into consideration that 97% of travelers consult reviews before booking and a one-point change in review scores can influence ADR by as much as 11.2%, even a modest decline can reduce booking conversion and a property’s ability to command premium rates. 

By bringing sentiment data onto your core financial dashboard right alongside GOP and RevPAR, you’ll get an earlier warning system that allows you to correct operational flaws before margins take a hit. 

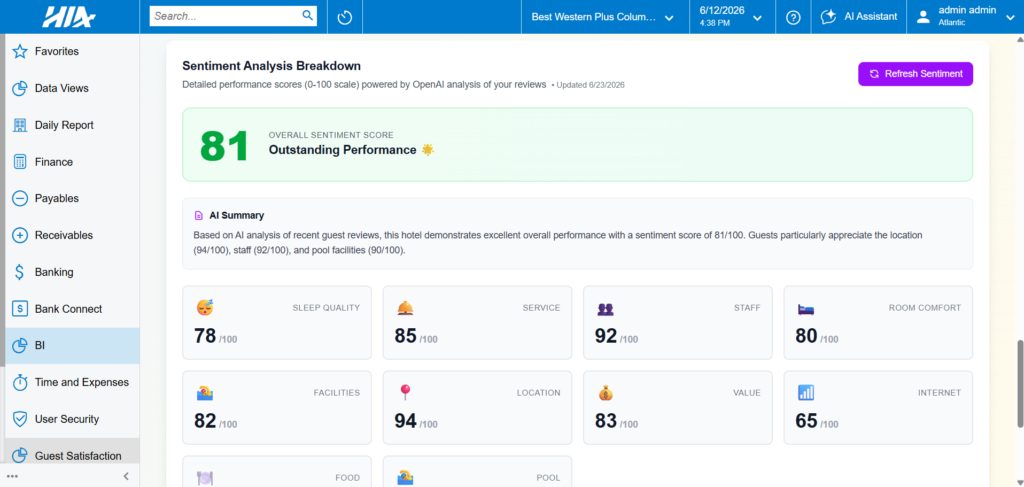
An example of HIA’s GSS Sentiment tool that compiles ratings across third-party platforms to give users both overall rating and sentiment scores

An example of HIA’s GSS Sentiment tool that compiles ratings across third-party platforms to give users both overall rating and sentiment scores

4-6. Labor Efficiency KPIs

Labor might be the single largest controllable expense in hotel operations, yet for many management companies, it’s consistently one of the hardest costs to monitor in real time. That’s because most of the solutions used to manage labor often sit outside the ERP. 

It’s easy for GMs to feel when the pace of the operation changes and make adjustments on the fly, but they don’t get to see the true dollar cost until payroll processes days after the period ends. 

To gain more visibility into labor efficiency, there are three key KPIs to track: 

    • Cost Per Occupied Room (CPOR): This baseline helps you evaluate operational discipline across the entire portfolio. By isolating expenses regardless of property size, room count, and rate tier, it gives you a single metric to evaluate performance which you can use to negotiate bulk purchasing agreements and set hard operational caps per guest stay.
    • Minutes Per Occupied Room (MPOR): Hours per occupied room might set the benchmark for the portfolio, but MPOR is what actually helps protect the margins. Even small drifts can compound into thousands of dollars across a multi-property portfolio, which is why it’s beneficial for regional leaders and GMs to have access to this granular data. 
  • Overtime Hours and Overtime Percentage: While other productivity metrics tell you how efficiently staff is moving, OT tells you how effectively your schedule is holding together. Tracking OT in real time gives GMs and controllers the visibility to rebalance shifts and intervene before it erodes profits.

Together, these KPIs give operators the information they need to manage their single largest cost line in real time instead of in the rearview mirror. 

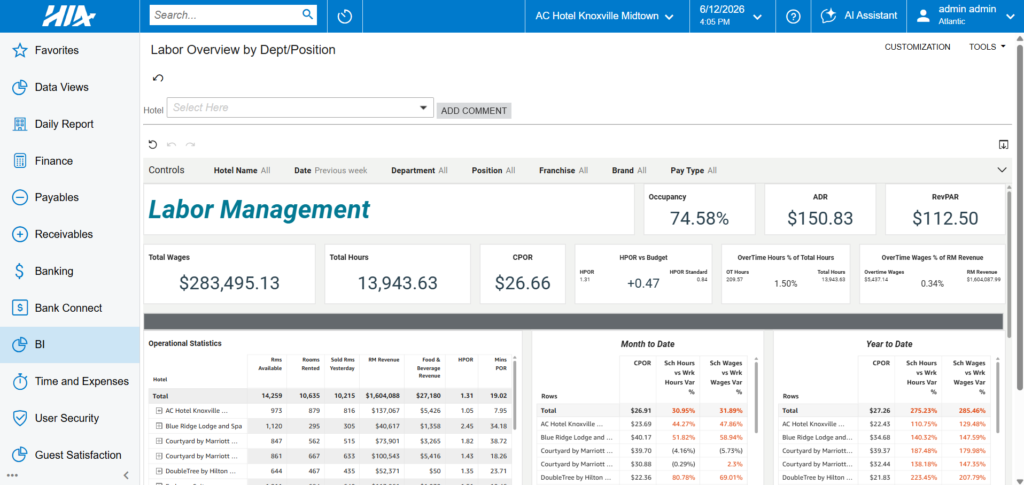
An example of HIA’s Labor Management tool that provides real-time visibility into labor costs, productivity, and overtime trends.

An example of HIA’s Labor Management tool that provides real-time visibility into labor costs, productivity, and overtime trends.

7-9. Cash & Payables KPIs

Even if you keep your finger on the pulse of where your finances are heading, it won’t matter if your back-office financial control is flying blind. When controllers have to log in to 10 different banking portals and navigate complex AP workflows just to see where cash actually stands, cash management becomes another chore that slows decision-making. They need to have unified access to these three core cash and payables KPIs (at a bare minimum) to get real-time financial control.

  • Consolidated Cash Position: Fragmentation is a silent tax on performance. Unifying all your cash balances in a single, real-time view eliminates that drag and gives you the confidence to make fast, strategic decisions based on your current liquidity. 
  • 7-Day Cash Outflow Forecast: Looking at today’s cash balance only tells you where you stand. Looking seven days ahead tells you what decisions you still have time to make. Projecting payables against short-term revenue inflows provides the foresight needed to smooth out uneven cash weeks or pay key vendors early to capture dynamic discounts. 
  • AP Aging / Overdue Balances: While cash forecasts tell you when cash is leaving, AP aging reveals how effectively your payment terms and vendor relationships are holding together. Controllers need this visibility to resolve issues before they become liabilities.

The KPI Most Companies Skip: Vendor Purchasing Trends

Sometimes the biggest savings can’t be found on the P&L; they’re hidden in purchasing patterns. 

Let’s say three of your properties are buying products from the same distributor at three different negotiated rates. At that point, you’re not only leaving money on the table, but you’re also diluting your GOP across the entire portfolio. 

Analyzing purchasing patterns and price variance across all your assets helps teams expose inconsistent buying behavior, such as rogue off-contract buys or billing irregularities that signal potential fraud. More importantly, it equips finance leaders with the consolidated portfolio data needed to negotiate better pricing and protect the bottom line. 

When you understand what you’re buying, how often you’re buying it, and who you’re buying it from, AP becomes a strategic negotiation partner that helps protect margins while strengthening vendor relationships. 

One Dashboard, Not Ten Logins

The hardest thing about tracking the KPIs we’ve just talked about is being able to monitor them from the same platform. Most hotel management companies have to jump between multiple sources, collecting and compiling the information they need manually, before they can even begin analyzing it.

HIA eliminates that disconnect by bringing all that information together in a single, hospitality-native ERP with integrated BI and AI layers. Dashboards give you a complete view of portfolio-level and property-level performance, and when you need a quick answer, the AI Assistant lets you ask questions in plain English without hunting through reports or exporting data. 

When your data lives in one trusted place, the conversation shifts from finding answers to acting on them. If you’d like to see more of how HIA’s BI and AI tools work, schedule a demo with our team.

Charlie Fritsch, Founder & CEO - HIA
Charlie Fritsch, CEO

Charlie Fritsch is CEO and Founder of Hotel Investor Apps, Inc., makers of HIA, the ERP purpose-built for hospitality. With over 30 years of hotel brokerage and commercial real-estate and capital funding experience, Charlie created HIA with the express intent of simplifying and elevating hospitality financial management. Charlie is committed to always expanding HIA’s capabilities to further consolidate and streamline hospitality back-office functionality.

« Native vs Third-Party AI: Why Two AI Solutions Can Give You Very Different Answers Rates Up, Reviews Up, Margins Flat: What I Actually Heard at Hotel Data Conference 2026 »

Recent Posts

Rates Up, Reviews Up, Margins Flat: What I Actually Heard at Hotel Data Conference 2026

Rates Up, Reviews Up, Margins Flat: What I Actually Heard at Hotel Data Conference 2026

August 19, 2026
Native vs Third-Party AI: Why Two AI Solutions Can Give You Very Different Answers

Native vs Third-Party AI: Why Two AI Solutions Can Give You Very Different Answers

July 29, 2026

In The News

HIA Promotes Two Senior Leaders, Launches Dedicated Customer Success Department

July 2, 2026
HIA Launches 4 AI Features Built Natively into its Hospitality ERP

HIA Launches 4 AI Features Built Natively into its Hospitality ERP

June 17, 2026

Case Studies

Rainmaker Hospitality Builds a Foundation for the Future with HIA ERP & Accounting Software

Rainmaker Hospitality Builds a Foundation for the Future with HIA ERP & Accounting Software

May 4, 2026
Platform Business Advisors scales smarter with HIA Hospitality ERP

Platform Business Advisors Scales Smarter with HIA Hospitality ERP

March 26, 2026

Downloads

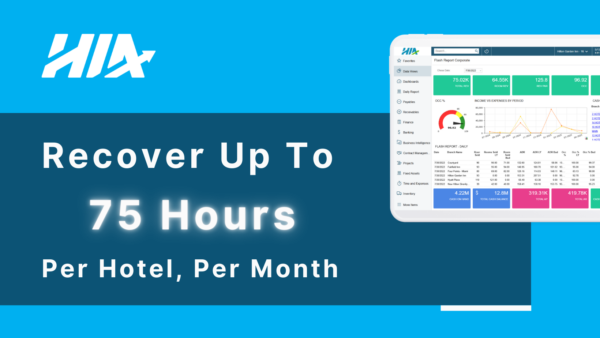
Recover Up to 75 Hours Per Hotel Per Month

Recover Up To 75 Hours Per Hotel, Per Month

December 15, 2025
US Lodging Industry Update: The End of the Doldrums? Outlook for 2026 by R. Mark Woodworth

Outlook for 2026 – The End of the Doldrums?

October 22, 2025

Recent Videos

3 Best Practices For a Success Hotel Accounting Software Implementation

3 Best Practices for Hotel Accounting Software Implementation

June 23, 2026

1-Minute HIA Overview

June 23, 2026
Hotel kpi executive review binder with blank reporting tabs and approval objects.

Hotel KPI: What Operators Need Before The Dashboard

August 20, 2026
Hotel inventory management software source-of-truth folio with stock items, purchase orders, invoices, vendors, and property reporting cards.

Hotel Inventory Management Software: What Operators Need Beyond Counts

August 18, 2026
Hotel business intelligence source-of-truth folio with property activity, finance, labor, forecast, and owner reporting cards.

Hotel Business Intelligence: What Operators Need Before The Dashboard

August 17, 2026
Hotel property management system folio beside a governed ERP binder with property, finance, approval, and owner-reporting objects.

Hotel Property Management System: What Operators Need Beyond The PMS

August 14, 2026
HIA - Hospitality Intelligence Acconuting Logo HIA, A Product Of © Hotel Investor Apps Inc.
All rights reserved.

  • Website Terms Of Use
  • Privacy Policy
  • Application Privacy Policy
  • Contact Us
Award
2025 Travel and Hospitality Top Hotel ERP Solution
Award
2025 Acumatica Excellence Award Vertical Innovation
Award
2026 Acumatica Excellence Award Vertical Innovation
Award
2026 HTR Finalist Best Hotel Accounting Software
Award
Level 1 Certfied Customer Support
10 Years
10 Years of Empowering Hotel Management Excellence