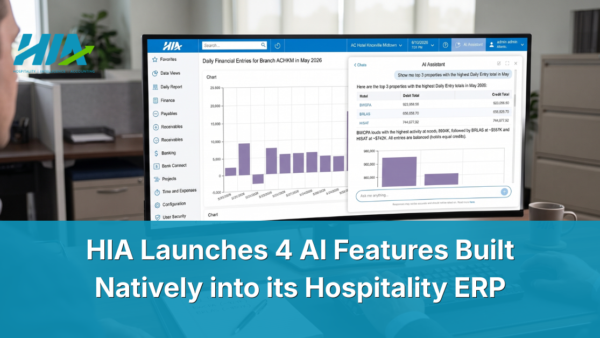
AI-Powered Platform
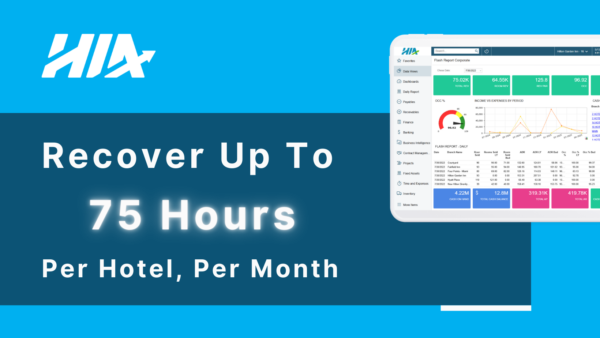
Backoffice Automations

Hotel ERP Platform
Ops & Accounting Clarity

Integrations
60+ Hospitality Specific

Features & Capabilities
Built for Hotels

GSS Analysis
Rep Mgmt, Comp Sets, Rate Intel

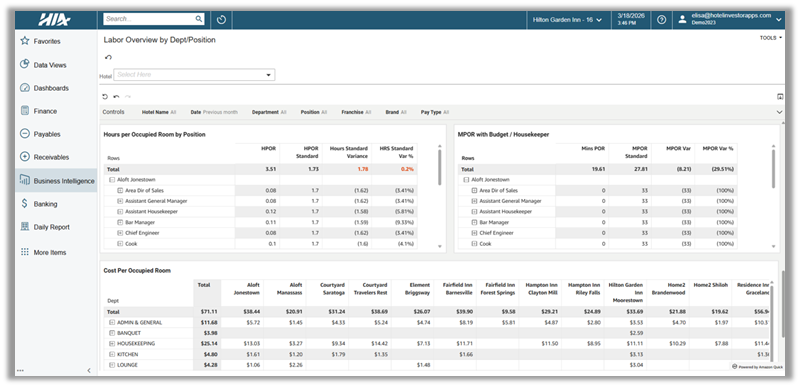
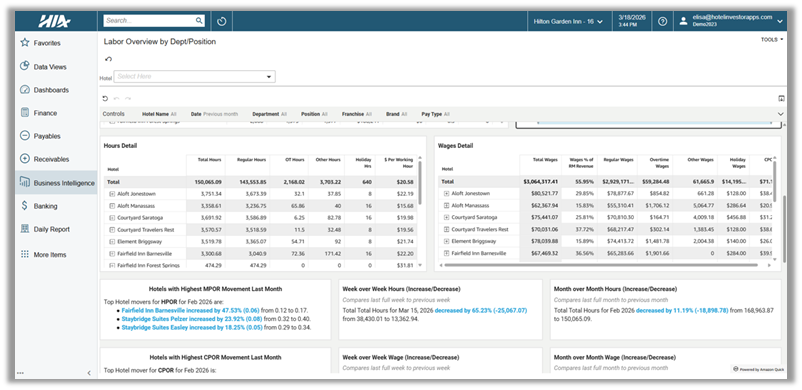
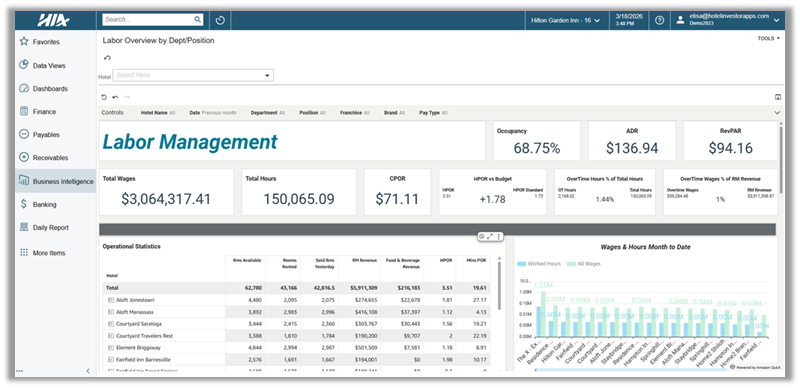
Business Intelligence
Your Whole Hospitality Timeline

Mobile App
Your Backoffice in Your Pocket