

HIA Image
Press Release: HIA Launches 4 AI Features Built Natively into its Hospitality ERP
Hotel ERP and Accounting Software Logo Hotel ERP and Accounting Software Logo
  • Home
  • Platform
      Hospitality Accounting & Operations
    • AI-Powered Platform
      Backoffice Automations

    • Hotel ERP Platform
      Ops & Accounting Clarity

    • Integrations
      60+ Hospitality Specific
    • Features & Capabilities
      Built for Hotels

    • Halo GSS
      Rep Mgmt, Comp Sets, Rate Intel
    • Business Intelligence
      Your Whole Hospitality Timeline

    • Mobile App
      Your Backoffice in Your Pocket
  • Features By Role
    • For Finance Teams
    • For Operations
    • For Executives
    • For Owners
  • About Us
    • Executive Team
    • Acumatica
    • Awards
    • Board of Directors
    • Support
    • Careers
    • Contact Us
  • Resources
    • Blog
    • In The News
    • Customer Stories
    • Guides & Downloads
    • Videos
Request A Demo

Uncertain Economy, Steadier Hotels: A Look at 2026 and the Road to 2027

October 13, 2026
By R. Mark Woodworth
  • News Headlines
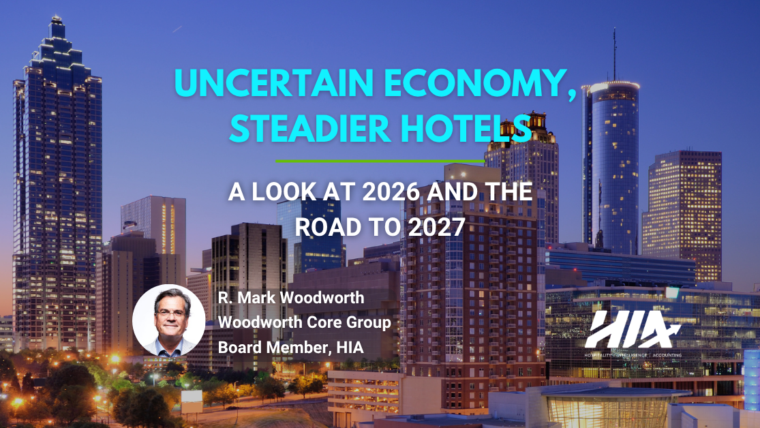
Unsteady Economy, Steadier Hotels: A Look at 2026 and the Road to 2027. By R. Mark Woodworth, Principal of Woodworth Core Group, and Board Member of HIA.

By R. Mark Woodworth, Principal, Woodworth Core Group

Mark Woodworth, Principal of Woodworth Core Group and Board Member of Hotel Investor Apps, Inc., makers of HIA ERP & Accounting software, brings over 40 years of hospitality industry advisory experience, including at CBRE Hotels and PKF Consulting, to inform his perspective on the current economic outlook for the U.S. lodging industry. 

As hoteliers prepare budgets for 2027, here are some questions to ask yourself: How do you feel about today’s economy: good, okay, or bad? Will the economy be better, the same, or worse in 2027?  Will 2026 hotel performance end up better than, the same as, or worse than you expected a year ago, and will 2027 be up, flat, or down relative to today?  My opinion, based on over 40 years of hospitality industry advisory experience, is that the mood is worse than the data. Today’s economy is OK, next year will be better, and hotels will outperform the mood.

A Steady Economy with Weak Sentiment

Americans feel worse about the economy than the numbers justify. The Conference Board’s Leading Economic Index (LEI), a ten-part gauge that has historically anticipated turning points in the business cycle by about seven months, provides meaningful insight into where the domestic economy has been and where it is heading. The index remains well below its 2022 peak. Its six-month growth rate, which spent long stretches since 2022 in recession-signal territory without a recession following, had climbed back to roughly zero as of July. Meanwhile, the Conference Board’s Coincident Economic Index (CEI) has been climbing relative to the LEI, a trend last seen during the recovery periods following the 2001 and 2008-2009 recessions. I see this as a sign that the economy is sturdier than the LEI alone suggests.

Consumer expectations for business conditions have been the main drag on the index, subtracting 1.26 points over the six months ending in July. Consumer confidence, at roughly 90 in August, has drifted down since 2021. By contrast, financial components such as the credit index, the stock market, and the yield spread all contributed positively.

The July consensus forecast is unremarkable in a good way. Real GDP grew 2.2% in 2025 and is projected at 2.1% for 2026 and 2.2% for 2027. Inflation is expected to fall from 3.58% at year-end 2025 to 2.61% at year-end 2026 and 2.30% at year-end 2027. Unemployment was 4.10% in July, with forecasts of 4.33% and 4.26% for year-end 2026 and 2027.

Markets have shrugged off the year’s shocks. The Dow closed at 51,462 on September 16, up 2,211 points (4.5%) from January 5, having recovered from the dips tied to April 2025’s “Liberation Day” tariffs and weathered the start of the Iran war this year.

That said, there are some longer-term concerns:

  • Foreign appetite for U.S. debt: Foreigners’ share of Treasuries has fallen by approximately 50 percent since 2009, while their share of U.S. equities has increased by 68 percent over the same period.
  • Labor supply: The working-age population grew by 31 million from 1995 to 2010 but only 12 million from 2010 to 2025.
  • Uncertainty: Policy uncertainty remains elevated, in the same range as past episodes such as the tariff spike.

Rates, Cap Rates, and Lenders: Higher Rates, but Lenders Are Warming

Rate cuts have fallen off the table. The quarter-point rate hike on September 16 was not a surprise, and the consensus calls for at least one more 25 bp lift before the end of 2026. The 10-year Treasury yield hovers around 5.0% near the end of Q3 2026 – this compares to the 2.73% average over the past decade. Moody’s AAA corporate bond yield, at roughly 5.9%, is below its 6.4% long-run average.

Research from my friend and former colleague Jack Corgel, President of Cordial Hotel Property Research, illustrates that there are four drivers of cap rate change:

  1. Rising interest rates push rates up.
  2. Decelerating cash flow pushes them up.
  3. Falling system-wide liquidity pushes them up.
  4. More volatility means higher cap rates.

Jack’s cap rate forecasting model, built on the Gordon Growth Model, indicates that hotel cap rates are a function of the risk-free rate plus a risk premium, minus income growth. On average, income growth contributes 36% of the model’s predictive power, the risk-free rate 31%, and the risk premium 27%. Other variables, such as the debt-to-GDP ratio, each add less than 5%.

According to CoStar, hotel cap rates have averaged 9.4% in 2026, about 30 basis points above the 9.1% long-term average. Since early 2022, though, the 10-year Treasury yield has risen roughly 250 basis points while cap rates have risen only about 100. The spread over the 10-year has narrowed to 4.92%, well below its long-run average of 569 basis points.

Lenders are showing more appetite. Bank survey data through August show stronger demand for commercial loans, standards for commercial and industrial loans hovering near neutral, and, notably, standards for construction and land development loans turning slightly easier on net.

Given the above, hotel cap rates will likely trend slightly up over the next year or two.

Lodging Fundamentals: Turning in Hotels’ Favor

Both supply growth and demand growth have trended down for decades. Net domestic supply change has recently been running below 1% a year. The expansion in short-term rentals may explain part of the demand story. U.S. STR listings grew from 1.16 million in 2019 to 1.71 million in 2025, with 1.78 million forecast for 2027 according to AirDNA. Over the same period, their data show average nightly price rising from $193 to $256 and occupancy inching from 56.2% to 57.1%.

Hotel demand slipped year over year through much of 2025 (the second through fourth quarters), then turned positive in the first two quarters of 2026 across nearly every chain scale and location type. Group business is mixed. In a survey of 210 destination marketing organizations, first-half 2026 leads were up 10% and bookings up 3%, but booked room nights fell 4%, driven by convention center events. Technology and sports events continued to grow.

Affluent travelers are a big part of the story. Households earning $200,000 or more make up 11% of households but account for 36% of leisure lodging spending, up from 25% in 2018, according to Tourism Economics. Adding the $150,000 to $199,000 bracket brings the combined share of leisure lodging spending to 51%.

The cost side has improved too. A year ago, hotel departmental expenses were rising far faster than revenues: 5.5% versus 3.4% in May 2025. Beginning in March 2026, revenue growth overtook expense growth. In May 2026, revenues were up 3.8% against expenses up 1.7%.

Forecasts: From Weak to Solid

Late-2025 forecasts for 2026 were subdued, averaging just 1.0% RevPAR growth (CBRE, STR, PwC, and LARC). Updated forecasts now average 3.6% RevPAR growth for 2026, driven by 0.7% occupancy growth and 2.8% ADR growth. Year-to-date through August, CoStar shows RevPAR up 5.2%, with occupancy up 2.0% and ADR up 3.2%.

Mark Skousen at Chapman University recently authored an interesting piece in The Wall Street Journal.  He notes that the domestic economic picture is changing, as shown by the macro statistic that measures spending at all stages of production.  GDP does not directly address what is happening in the supply chain, which is a leading indicator.  A broader statistic, known as gross output, or GO, measures spending at all stages of production.  Skousen notes that “business spending in the supply chain is much bigger and more volatile than final consumption and does a better job of measuring the ups and downs of the business cycle.” Second-quarter 2026 GO growth was substantial, and GO is now growing faster than GDP, which is significant.  This may help to explain why the lodging industry has outperformed most expectations thus far in 2026.  GO growth is expected to be even stronger in 2027.

That being said, industry forecasters expect a slower pace for U.S. hotels in 2027. The average estimate calls for 0.6% occupancy growth, 1.4% ADR growth, and 2.0% RevPAR growth.  Many unknowns remain today that will become clearer in the months ahead; chief among them are the results of the November elections.  We will hopefully have more clarity on the outcome of the war in Iran and its impact on energy prices as well.  Uncertainty should dissipate as a result.

My guess is that 2027 will likely see something greater than a 2.0% increase in U.S. RevPAR.  Something in the 3.0% to 3.5% range feels a little better.

The Bottom Line: Steadier Hotels Ahead

Some closing thoughts:

  • Uncertainty: Uncertainty over economic policy, interest rates, and inflation will continue to shape market conditions.
  • Supply and demand: Demand growth is projected to outpace supply through the balance of this decade. Many hotel development projects don’t pencil out given limited market recovery, high construction costs, and high interest rates, so supply growth should stay below average.
  • The rest of 2026: “Wait and see” is likely to remain the norm among most industry participants. Sit tight – the year will be over soon.
  • Tailwinds: Continued elevated capital investment would benefit the economy and hotels, and fading “anti-American” sentiment should help inbound international travel.
  • The road ahead: 2026 has been a turnaround year for many U.S. hotels, particularly at the high end. 2027 and beyond should bring steady growth.

Sources cited include the Conference Board, BEA, WSJ Consensus Forecast, CoStar, AirDNA,  FRED, Policyuncertainty.com, the Wall Street Journal, and Jack Corgel of Cornell University.

« Lowen Hospitality Cuts Monthly Close Time by Over 30% and Achieves Near Real-Time P&L with HIA ERP

Recent Posts

The Growth Tax on Hotel Finance Teams

The Growth Tax on Hotel Finance Teams

October 1, 2026

Why Hotel Management Companies Fall Behind on AR — And How to Fix It

September 15, 2026

In The News

Lowen Hospitality Cuts Monthly Close Time by Over 30% and Achieves Near Real-Time P&L with HIA ERP

October 2, 2026

HIA Promotes Two Senior Leaders, Launches Dedicated Customer Success Department

July 2, 2026

Case Studies

How Lowen Hospitality Management Positioned Itself for Growth with HIA ERP

August 31, 2026
Rainmaker Hospitality Builds a Foundation for the Future with HIA ERP & Accounting Software

Rainmaker Hospitality Builds a Foundation for the Future with HIA ERP & Accounting Software

May 4, 2026

Downloads

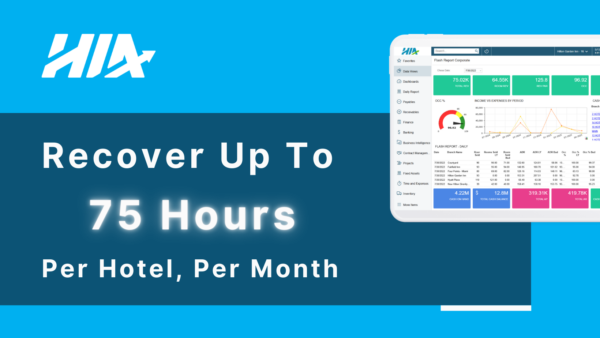
Recover Up to 75 Hours Per Hotel Per Month

Recover Up To 75 Hours Per Hotel, Per Month

December 15, 2025
US Lodging Industry Update: The End of the Doldrums? Outlook for 2026 by R. Mark Woodworth

Outlook for 2026 – The End of the Doldrums?

October 22, 2025

Recent Videos

3 Best Practices For a Success Hotel Accounting Software Implementation

3 Best Practices for Hotel Accounting Software Implementation

June 23, 2026

1-Minute HIA Overview

June 23, 2026
Hotel night audit packet with daily revenue cards, PMS folio, reconciliation check, and finance ledger.

Hotel Night Audit: What Operators Need After The Daily Close

August 31, 2026
Hospitality software source-of-truth binder with PMS card, finance ledger, approval seal, BI folio, and owner reporting packet.

Hospitality Software: What Hotel Operators Need Beyond Point Tools

August 27, 2026
Hotel asset management portfolio review folio with property tabs, owner packet, financial ledger, and performance cards.

Hotel Asset Management: What Owners Need Before Portfolio Review

August 26, 2026
Financial reporting software owner-review packet beside a governed hotel ERP ledger, budget cards, and property tabs.

Financial Reporting Software for Hotels: What Operators Need Before Owner Review

August 25, 2026
HIA - Hospitality Intelligence Acconuting Logo HIA, A Product Of © Hotel Investor Apps Inc.
All rights reserved.

  • Website Terms Of Use
  • Privacy Policy
  • Application Privacy Policy
  • Contact Us
Award
2025 Travel and Hospitality Top Hotel ERP Solution
Award
2025 Acumatica Excellence Award Vertical Innovation
Award
2026 Acumatica Excellence Award Vertical Innovation
Award
2026 HTR Finalist Best Hotel Accounting Software
Award
Level 1 Certfied Customer Support
10 Years
10 Years of Empowering Hotel Management Excellence